Defining populations
The following rationale and assumptions were made when defining populations.
(1) Home range size versus linear movement data: Although we have good estimates of home range sizes for eastern indigo snakes in portions of the range (Appendix A), applying a home range area drawn as a circle around records could exclude a significant portion of the actual home range due to a wide variation in documented home range widths and shapes. Alternatively, we buffered records by maximum annual linear movement distance to estimate the potential maximum extent of the home range for a given record (Figure B1 below for illustration). This approach is inclusive and captures all the area possibly used by the eastern indigo snake responsible for a given record and therefore represents its biological potential to move in a given area. A similar approach was applied by Bauder et al. (2018, p.747) to define study areas (using 2.4 mi/3.86km as the buffer distance) for assessing influence of habitat variables on eastern indigo snakes in central Florida.
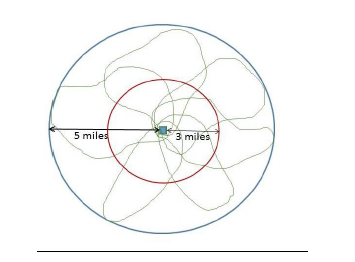
(2) Five-mile buffer distance: Eastern indigo snake movements are known to vary between northern and southern populations (Appendix A) with northern populations generally having larger home ranges and moving longer distances. It is assumed that southern populations (Peninsular Florida) could also move 5 miles (one male was documented to travel about 4.3 mi (7 km) (Breininger and Bolt unpublished data), but may not need to move as far due to less of a dependency on winter habitats containing viable gopher tortoise populations (shelter), and/or incompatible land use restricts their ability to move. Also it is possible additional eastern indigo snakes, and their home ranges, may occur between records used in this assessment.
(3) Demographic connectivity: Eastern indigo snake genetic structure has been shown to have high levels of contemporary gene flow across its range and has been described as continuously distributed, isolated by distance, rather than discrete evolutionary lineages (Folt et al. in review, p. 20). The 5-mile distance, applied here, is assumed to represent this potential for demographic connectivity and source-sink population dynamics. We assume that eastern indigo snakes that are within 5 miles of each other have increased probability of population persistence (re-colonization of sites after a stochastic event or local extirpation) resulting from periodic addition of immigrants from sources to sinks (Carlson et al. 2014, p. 521) within the populations defined in this assessment (e.g. immigrants from an area with good quality habitat into an area adjacent to (sub)urban development). Dispersal of individuals over longer (greater than 5 miles) distances is rare but is important for population connectivity (i.e. genetic connectivity), which is important for reducing inbreeding (genetic rescue) and may contribute to evolution necessary for adapting to environmental changes (Carlson et al., p. 532).
Resiliency
Population Factors
1. Population Extent– Measured as the cumulative area of each population created by overlapping 5-mile (8-km) buffers of the eastern indigo snake records. The area of one 5-mile radius circle is 50,265 acres (20,342 ha). At least two records must be present within 5 miles of each other to be considered a potential population and included in the analysis. Therefore, the resilience categories were defined as: Low: <100,000 acres (<40,469 ha) represents records occurring very close to each other that may represent the same snake and would have a small population extent. Two or more records within 5 miles of each other but spaced relatively further apart would have population extent closer to 100,000 acres. Medium: 100,000 to 300,000 acres (40,469 to 121,405 ha); 150,000 acres (60,703 ha) represents 3 times the area of a 5-mile radius circle and would include at least 3 eastern indigo records. High: >300,000 (>121,405 ha) acres and represents numerous records distributed across a broad area.
Although some species may expand their home range when habitat quality declines (Van Horne 1983, entire), studies on eastern indigo snakes found that home ranges in urban and fragmented landscapes were significantly smaller than those of snakes in more natural landscapes (Breininger et al. 2011, Bauder et al. 2018, p. 13). Although home ranges of eastern indigo snakes tracked in Georgia showed some degree of overlap (Hyslop et al. 2014, p.106), same-sex home range overlap was reported to be generally very low in Peninsular Florida (Bauder et al. 2016, p. entire). Therefore, we assume there is increased potential for more individuals to interact within larger population extents and therefore resiliency increases.
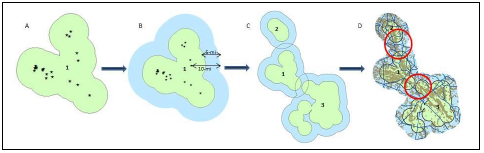
2. Population Connectivity– Measured as the overlap and presence of connected suitable habitat among populations within a 5-mile buffer around populations. This “population connectivity buffer” is represented by a 10-mile buffer around eastern indigo snake records (or a 5-mile buffer from record = population plus an additional 5-mile buffer to assess overlap (i.e. connectivity) among populations).
Connectivity to other populations is critical in maintaining gene flow and ability to adjust to changing conditions. Primary and secondary roads represent significant barriers to connectivity. Bauder et al. (2018, p. 751) found that eastern indigo snakes had a “near zero” probability of crossing primary and secondary roads (defined below under 5. Tertiary Road Density). Furthermore, snakes need suitable habitat to successfully move across the landscape. Therefore, we counted the number of overlapping “population connectivity buffers” for each population. Then we examined the habitat (using the Eastern Indigo Snake Habitat Model, Appendix C) within the overlapping area. Populations were considered “connected” if habitat patches were present between populations and were not bisected by one or more primary or secondary roads. Resilience categories were defined as: High: population connected to 2 or more populations, Medium: population connected to at least 1 other population, Low: population connectivity buffer overlaps with at least one other population connectivity buffer but is fragmented by a major road (primary or secondary). Very Low: population is not connected to another population. See Figure B2 for illustration.
Habitat Factors
1. Habitat Quantity and Type: A Geographic Information Systems (GIS) model was generated for the eastern indigo snake (Appendix C) to assess the current range-wide status of habitat availability and quality (Figure 22). Habitat patches were categorized as primary, secondary and tertiary habitat. Primary habitat identifies the characteristic natural upland habitats preferred by eastern indigo snakes across most of its range. Secondary habitats include other natural habitats, including lowlands, often important for foraging. Tertiary habitats include human-altered landscapes (e.g. pasture, citrus orchards) that may also support critical resource needs. For a complete description of the model methodology, refer to Appendix C. Because we know eastern indigo snakes have relatively large home ranges and conspecific overlap of eastern indigo snakes is generally low, it is assumed that habitat quantity requirements are relatively large. Therefore we assessed the total amount of habitat (primary + secondary + tertiary) for each population
Resiliency categories were defined for habitat quantity (regardless of patch sizes) as high, medium, low and very low categories by assessing the total amount of habitat per population. High condition are those populations that have more than (>) 150,000 acres of habitat (more than half of the 300,000 acres population extent required for a High condition population extent score and Medium are those with 50,000-150,000 acres of habitat (half of the 100,000 – 300,000 acres population extent required for a Medium condition population extent score, and so on for Low and Very low conditions. Very Low are populations with less than 20,000 acres of total habitat. Habitat quantity measures total habitat regardless of patch size. The degree of fragmentation (size and number of habitat patches) is an important habitat factor and is considered as a separate measure of habitat quality (described below).
2. Primary and Secondary Habitat: Eastern indigo snakes require diversity in habitat types to support essential life functions of breeding, feeding, sheltering and nesting. They depend on (in northern portion of range) or prefer (southern portion of range) upland habitat types as their primary habitat. In the northern portion of the range they are highly dependent on sandhills with gopher tortoise burrows for shelter during winter months. In central and south Florida the dependence on gopher tortoises is less and they are known to use a variety of habitats and shelters, however, snakes continue to exhibit a strong preference to upland habitats (Bauder et al. 2018 pp. 754-755). Secondary habitat is also natural, but is generally hardwood, lowland and wetland dominated habitat types and is often used for foraging (feeding). It is believed that a combination of both primary and secondary habitat provides the best matrix of habitat types to support viable eastern indigo snake populations. Tertiary habitat represents potential foraging habitat, but are human altered such as citrus orchards and agricultural fields. Eastern indigo snakes are known to use these habitats, but generally will avoid citrus and pastureland (Bauder et al. 2018, p. 754). Tertiary habitat often has altered ecology and increased vulnerability to stressors (e.g. roads, predators, disease, human interaction, etc.) making these habitats of lower quality, therefore we assessed the percent of total habitat that is considered primary and secondary versus tertiary as a measure of habitat quality.
Primary habitat (preferred habitat and important for all essential life functions) and secondary habitat were considered together as a measure of habitat quality because primary habitat varies between northern and southern populations such as upland dry hardwood forest (potentially considered secondary for northern populations and primary for southern populations). Together primary and secondary habitats are generally natural habitats that provide important habitat for eastern indigo snakes.
3. Shelter (Gopher Tortoise): We examined gopher tortoise population data gathered from the 2018 Gopher Tortoise CCA Annual report (CCA 2018); and data acquired from the States of Georgia (unpublished data) and Florida (unpublished data). Throughout its range eastern indigo snakes require shelter for protection from temperature extremes and shelter from predators. In the northern parts of the range eastern indigo snakes are highly correlated with gopher tortoises and depend on the burrows for hibernacula during winter. In the central and southern portions of the range burrows remain important shelter, but eastern indigo snakes may use other types of shelter where gopher tortoise burrows are absent or in low densities.
For each population the presence of Gopher Tortoise Minimal Viable Populations was assessed. Minimum Viable Population (MVP) for the gopher tortoise is 250 adults with a density of no less than 0.4 tortoises/ha and that the minimum reserve size for a MVP to persist is 100 ha of superb habitat. Primary Support Populations are populations with between 50-250 adults which are candidates for population restoration by improving habitat to increase natural recruitment, or through population augmentation to attain MVP status. By definition, Primary Support Populations must occur on sites large enough to sustain a MVP. Secondary Support Populations are populations of <50 adults, some of which are constrained from reaching primary support status because of limited habitat or management options. Secondary Support Populations are important for education, community interest, or can be used for augmentation purposes. If sufficient potential habitat is present and managed, Secondary Support Populations are candidates for habitat restoration and/or population augmentation to attain Primary Support Population or MVP status (Gopher Tortoise Council 2014).
We counted the number of all MVPs, primary, and secondary support gopher tortoise populations for each eastern indigo snake population. A comparative Gopher Tortoise score was calculated for each population by dividing the number of gopher tortoise populations by 50,265 ac. The area of a circle with a radius of 5 miles is 50,265 ac. This area represents the possible maximum extent of an eastern indigo snake occurrence and is the minimum size of an eastern indigo snake population as defined in this assessment.
4. Habitat Fragmentation: Using the Eastern Indigo Snake Habitat Model (Appendix C), fragmentation was assessed by calculating the area of habitat patches of different sizes for each population. Habitat patches for this assessment could contain all three types of habitat (primary, secondary and tertiary). Breaks in habitat patches reflect significant breaks in habitat connectivity or non-habitat between patches and often were due to primary or secondary roads, major water bodies and other areas of non-habitat. It has been suggested that eastern indigo snake populations that occur on lands with multiple habitat patches of at least 2,500 ac (1,000 ha) (i.e. >5,000 ac), with few roads or human-altered habitats which increase habitat fragmentation and mortality, may have the best chance of long-term viability (Moler 1992, Breininger et al. 2004). A recent study suggested 2,500 ac is too small to support even a single pair of eastern indigo snakes and suggested about 12,000 – 22,000 ac (5,000 – 9,000 ha) of unfragmented habitat is needed to sustain eastern indigo populations in central Florida (Bauder 2018, p. 160). A modeling study by Sytsma et al. (2012, pp. 39–40) estimated a reserve size of 10,000 ac (4,047 ha) to be sufficiently large to support a small population of eastern indigo snakes.
However, Hyslop et al. (2014, p.109) reported that the collective extent of eastern indigo snakes studied around Fort Stewart in Southeast Georgia, where the snakes are believed to travel the farthest distance, was about 20,000 to 35,000 ac (8,000 to 14,000 ha). We used these suggestions from the literature to develop rules to classify the fragmentation of populations as shown in Table 2 (Section 5.2 in report). Therefore, populations with more than 75% of habitat patches that are >10,000 acres (or 50% are >20,000 acres) are considered High and populations where more than 50% of the patches are less than 5,000 acres are considered Very Low resiliency. Medium and Low resiliency condition classes are intermediate to High and Very Low. Resiliency increases as the proportion of patches size increases.
5. Tertiary Road Density: Primary and secondary roads can contribute to isolation and fragmentation of eastern indigo snake populations because they often avoid these types of roads. However, eastern indigo snakes have been found to readily cross tertiary roads subjecting individuals to road mortality which can contribute to population declines and conservation of large tracts of undeveloped land with low densities of tertiary roads is needed (Bauder et al. 2018, p. 759). Therefore, the density of tertiary roads was assessed as a measure of habitat quality for each population segment.
Tertiary road density is calculated as miles of road per population divided by 50,265 acres. The area of a circle with a radius of 5 miles is 50,265 ac. This area represents the possible maximum extent of an eastern indigo snake occurrence and is the minimum size of an eastern indigo snake population as defined in this assessment. Thresholds for High to Very Low were determined based on the distribution of road density across all populations. Transportation data (or road data) were acquired for each state (AL, FL, and GA) from the USGS National Map: National Transportation Dataset (USGS 2017). Primary, secondary and tertiary roads were grouped similar to Bauder et al. (2018) using the feature class code definitions as follows:
PRIMARY ROADS = S1100 Primary Road Road/Path Features: Primary roads are generally divided, limited-access highways within the interstate highway system or under state management, and are distinguished by the presence of interchanges. These highways are accessible by ramps and may include some toll highways.
SECONDARY ROADS= S1200 Secondary Road Road/Path Features: Secondary roads are main arteries, usually in the U.S. Highway, State Highway or County Highway system. These roads have one or more lanes of traffic in each direction, may or may not be divided, and usually have at-grade intersections with many other roads and driveways. They often have both a local name and a route number.
TERTIARY ROADS= S1400 Local Neighborhood Road, Rural Road, City Street Road/Path Features: Generally a paved non-arterial street, road, or byway that usually has a single lane of traffic in each direction. Roads in this feature class may be privately or publicly maintained. Scenic park roads would be included in this feature class, as would (depending on the region of the country) some unpaved roads.
NOT ASSESSED= S1500 Vehicular Trail (4WD) Road/Path Features: An unpaved dirt trail where a four-wheel drive vehicle is required. These vehicular trails are found almost exclusively in very rural areas. Minor, unpaved roads usable by ordinary cars and trucks belong in the S1400 category.
DEFINITIONS can be found at (https://www.census.gov/geo/reference/mtfcc.html)
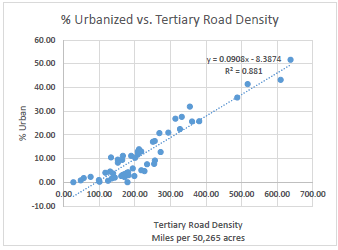
6. Percent (%) Urbanized: Urbanization destroys and fragments habitat and increases direct mortality due to increased human contact. While eastern indigo snakes have been observed entering urban and suburban areas (Breininger et al. 2004, p.15), in general eastern indigo snakes avoid urbanized areas (Bauder et al. 2018, p.754). Urbanized area is assumed to be correlated with the habitat factors above especially tertiary roads (Figure B3). For instance, habitat quantity and shelter site availability are assumed to decrease with increasing urban area, and habitat fragmentation and tertiary road density is assumed to increase with increased urban area. However, factors such as direct mortality from increased human and predator interaction would also increase with increasing urban area. Therefore as an additional measure of habitat quality, we assessed percent urbanized area for each population using the base model (2010) of the SLEUTH (Slope, Land use, Excluded area, Urban area, Transportation, Hillside area) model (Terando et al. 2014, p. 2). Percent of urbanized area was calculated for each population segment using the base model (2010) of the SLEUTH (Slope, Land use, Excluded area, Urban area, Transportation, Hillside area) model (Terando et al. 2014, p. 2). Eastern indigo snake response to specific thresholds of urban area are not known, however research on the impact of urban land cover and percent impervious surfaces provide a reasonable scale. Most watershed indicators decline when impervious surface exceeds 10% with severe degradation beyond 30% (CWP 2003, p1). Therefore thresholds for urban cover (i.e. impervious surface) were High <5%; Medium 5-10%; Low 11-30% and very low >30%.
Rational for weighting habitat factors in Table 2 (Section 5.2 in Report)
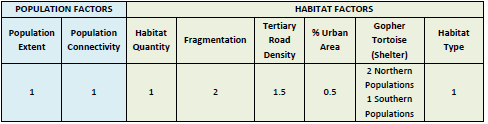
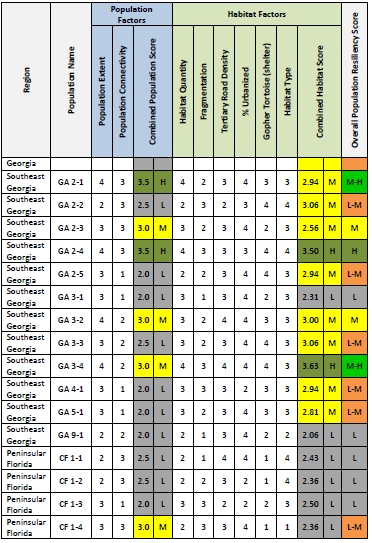
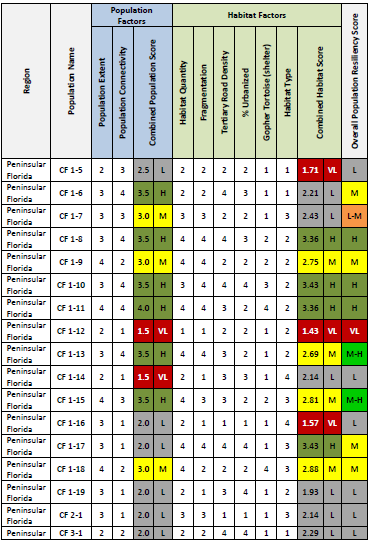
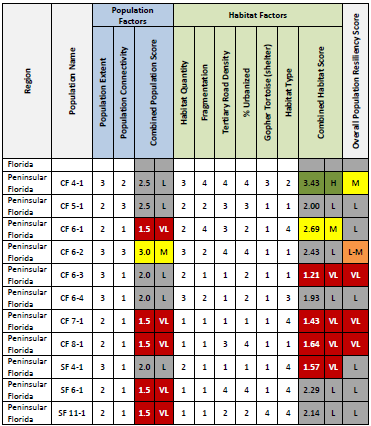
First, eastern indigo snake populations were assigned a score (“high” to “very low” represented by the numerical values of 4 to 1, respectively) for each population and habitat factor as described in Table 2 above. The population factors (population extent and connectivity) were considered equally important when estimating the combined population score, which was simply an arithmetic average of the two factors. To estimate the combined habitat score, habitat factors were given a baseline weight of 1 and then we adjusted the weights depending on their importance to eastern indigo snakes as documented in the literature. For northern populations gopher tortoise presence was given a weight of 2 because of the snake’s apparent dependence on gopher tortoise burrows for winter shelter sites compared to southern populations which was given a weight of 1. Because eastern indigo snakes have large home ranges, habitat fragmentation may have significant negative impacts on long-term population viability. Therefore, habitat fragmentation was given a weight of 2 for both northern and southern populations. Additionally due to the impact of direct mortality from tertiary roads, this factor was weighted as 1.5 for both northern and southern populations. Percent urban is highly correlated with tertiary roads (Figure B3), but also represents additional negative factors such as direct mortality from increased human and predator interaction. Therefore percent urban was given a weight of 0.5, giving tertiary roads and percent urban a cumulative weight of 2. The remaining habitat factors, habitat quantity and type, were each given a baseline weight of 1. Table B1 summarizes the assigned weights for the habitat factors.
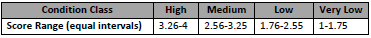
Next, using the scores and weights described above, we calculated a total population factor score and total habitat factor score for each eastern indigo snake population, which resulted in a continuous numerical value ranging between 1 and 4, and we assigned a condition class of High, Medium, Low or Very Low as described in Table B2.
Finally, we summarized overall current condition resiliency classes for each eastern indigo snake population by combining the total population and habitat condition classes (e.g. Population Condition Class = Medium (M) and Habitat Condition Class = High (H), Overall Current Condition Class = Medium-High (M-H); or Population Condition Class = Medium (M) and Habitat Condition Class = Low (L), Overall Current Condition Class = Medium-Low (L-M); or Population Condition Class = High (H) and Habitat Condition Class = Low (L), Overall Current Condition Class = Medium (M)). The intermediate condition classes (medium-high and medium-low) provide some insight to populations that are near the thresholds of the high condition class (medium-high) or medium condition class (medium-low), but are considered medium and low in overall condition, respectively. See Table B3 for calculations for each eastern indigo snake population. Figure 23 (in report) depicts each population and its estimated overall current resiliency condition class (Table B3 for naming conventions for each population).
It is fairly well-understood that eastern indigo snakes need large amounts of unfragmented natural, undeveloped habitat (with an emphasis on upland habitat types) because eastern indigo snakes have large home ranges and move considerable distances. Fragmentation is the result of primary and secondary roads, areas of non-indigo snake habitat (such as urban landcover), or large bodies of water that create patches of habitat in the habitat model. Habitat fragmentation can create too many “edges” that result in increased snake mortality (Breininger et al. 2012, p. 366) due to the snake’s large home range and increased exposure to various threats (roads, predators, invasive species, etc.). Additionally, habitat management can be negatively impacted by fragmentation, such as the ability to conduct prescribed fires. Therefore habitat fragmentation was given a weight of 2. Gopher tortoises (burrows) are critically important to northern populations of eastern indigo snakes and used opportunistically in southern populations, therefore presence of gopher tortoise populations was given a weight of 2 for northern populations, and a weight of 1 for southern populations. Tertiary roads do not generally create fragmentation within the habitat model (Appendix C) but these types of roads are believed to increased direct snake mortality from vehicular strikes because eastern indigo snakes will readily cross these roads compared to primary and secondary roads (Bauder et al. 2018, p. 757), therefore tertiary roads was given a weight of 1.5. Percent urban is highly correlated with tertiary roads (Appendix B, Figure B3), but also represents increased influencing factors such as direct mortality from increased human and predator interaction. Therefore percent urban was given a weight of 0.5, giving tertiary roads and percent urban a cumulative weight of 2. The remaining habitat factors, habitat quantity and type, were each given a baseline weight of 1.
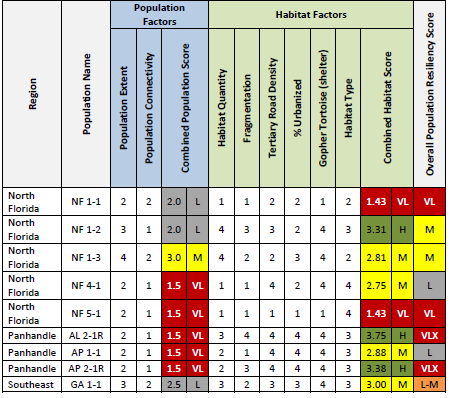
H= High; M-H= Medium-High; M= Medium; L-M= Medium-Low; L= Low; VL= Very Low. AL2-1R* and AP2-1R* are repatriation sites. Both have good habitat conditions, but population numbers are low, reintroductions are on-going and these populations are not considered viable at this time. Therefore, overall condition for these two sites is considered Very Low or Extirpated (VLX). There are 30 extirpated populations shown in Figure 21 in section 5.1 of the report that are not included in this table.
Representation and Redundancy
Population Extent (%) Decline– Using the approach described in section 5.1 in the report to define populations; we assessed changes in population extent by comparing historical and current distribution data to assess overall changes in distribution and range for the eastern indigo snake. Declines in population extent may reflect overall declines in abundance of individuals. Enge et al. (2013, p. 296) suggest that recent non-detection of the species in a particular area where it was historically detected might indicate substantial population declines or even extirpation. Population extent was calculated as the sum of the area created by two or more records within the 5 mile buffer. Population extent percent decline was measured as the change in extent (area) over time. “Over time” is described as the population extent of “recent” buffered records divided by the population extent of all buffered records (1936-2017). “Recent” records are those recorded post year 2000 as described by Enge et al. (2013).
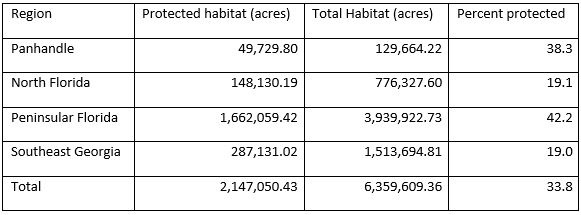
Conservation Status
To estimate the amount of eastern indigo snake habitat that is on protected land we used the Protected Areas Database of the United States (PAD-US) produced by the USGS Gap Analysis Program. PAD-US is the official inventory of public parks and other protected open space held in trust by thousands of federal, state, and regional/local governments, as well as non-profit conservation organizations (Gergely and McKerrow 2016). The spatial data are available for download online and for the purposes of this report are current through 2016 (USGS 2016). We clipped the eastern indigo snake habitat produced by the habitat model (see Appendix C) by the eastern indigo snake populations. Then we clipped the eastern indigo snake habitat by the protected areas boundaries. Finally, we summarized the area of habitat within the protected areas (Table B6).