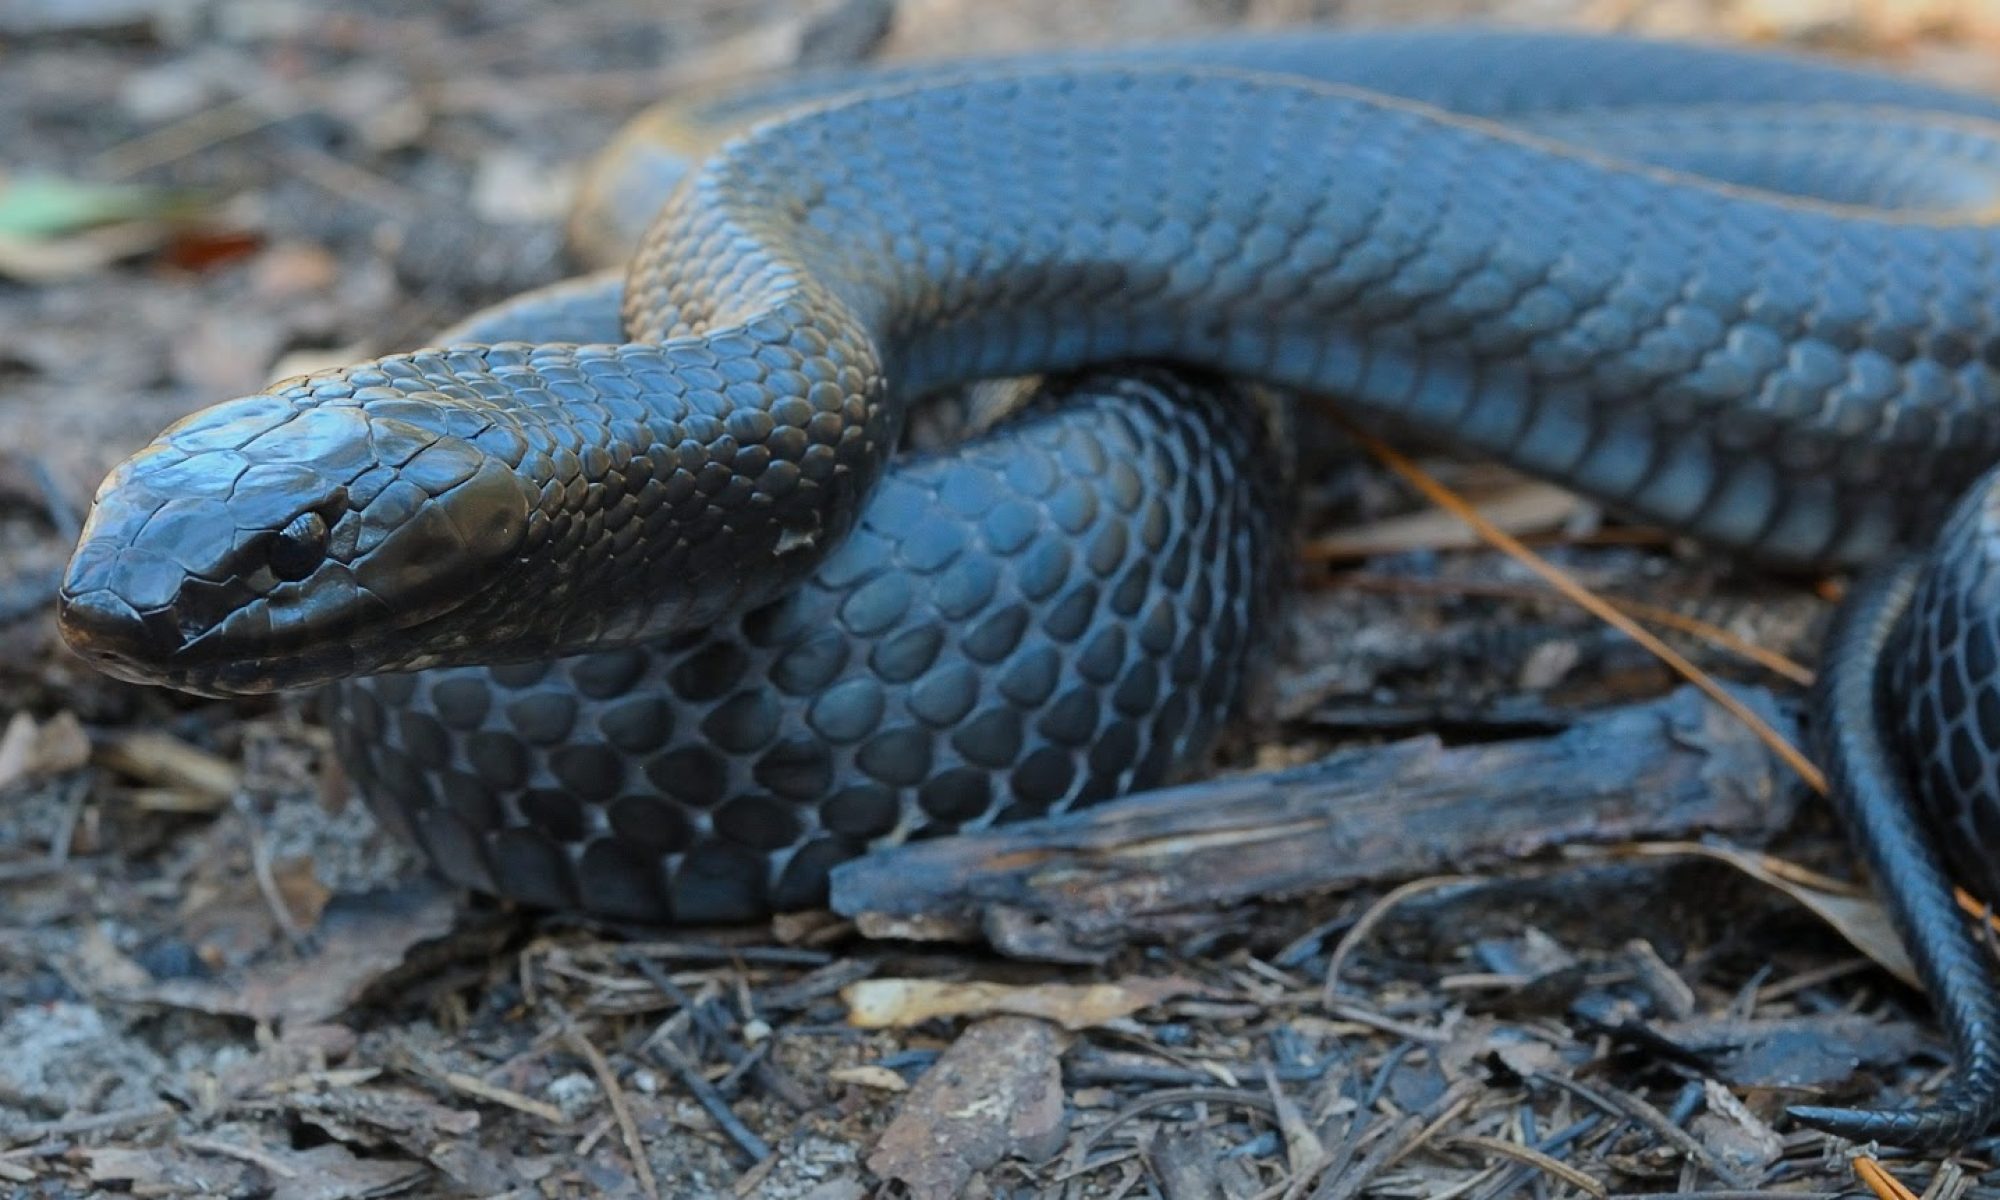
To assess the biological status of the eastern indigo snake across the species’ range, we used the best available information, including peer reviewed scientific literature, academic reports, professional judgement from eastern indigo snake and other experts, and occurrence data provided by State agencies, the Service, and conservation organizations to inform our analyses. Methodology differs among surveys and studies, but ultimately provides information that allows for assessment of population factors.
It is difficult to delineate biological populations of the eastern indigo snake across its range due to the snake’s large home ranges, secretive behavior, low densities, and other challenges associated with identifying population boundaries. However, over the past decade, progress has been made via research and monitoring efforts to better understand the needs of eastern indigo snakes. We have element occurrence (EOs) data collected over time (a few very early 1800’s records, but mostly between the years 1936-2017). These EOs, hereafter called records, are documented as geographic coordinates (latitude, longitude) that can be displayed in a GIS and represent unique observations of eastern indigo snakes at specific locations on specific dates in time. Range-wide species occurrence data used in this analysis is from Enge et al. (2013, entire), which includes records up to the year 2012. These records were composed of Type I and Type II records. Type I records were supported by voucher specimens or photographs, published in the literature, or had been verified by one of the authors. Type II records were not substantiated with a specimens or photograph but were reported by biologists or other qualified individuals deemed credible by the authors (Enge et al. 2013, p. 290). Occurrence records from 2013 to 2017 were obtained directly from State Natural Heritage Programs, State Biologists and conservation organizations in Florida and Georgia. It is important to note that records are not evenly distributed across the range. The number of records varies across the range with some areas having many records from research and monitoring efforts to other areas having no, or few, records which could represent lower densities of snakes or the area is under-surveyed. In addition, records may represent the same individual snake documented at multiple points in time. Numerous records are from observations on roads (dead or alive).
In addition to the eastern indigo snake records, there is an expanding body of research describing eastern indigo snake home range size (Appendix A), movements and relationships to landscape condition (see section 2.5). Based on this available information we define populations for the eastern indigo snake as described below.
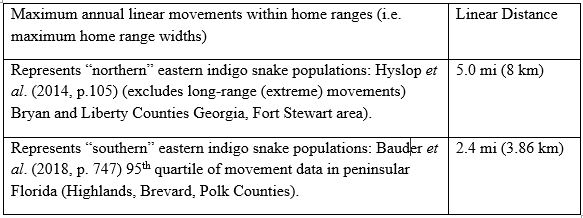
Populations are the basic analytical unit on which resiliency is assessed. For this assessment we delineated populations for the eastern indigo snake by using the location of a record buffered by the snake’s estimated maximum home range width (i.e. maximum annual linear distance movement). Home range shape and width are irregular and respond to landscape condition and presence of other eastern indigo snakes (Bauder et al. 2016a,b, Bauder et al. 2018). Home range area and movement distances are also known to vary latitudinally across the eastern indigo snake’s range due to climatic differences (Appendix A). In the northern portion of the range (Southeast Georgia, North Florida and the Panhandle) home ranges and movement distances (Table 1) are larger due to the species’ migration-like movements between summer and winter habitats where eastern indigo snakes depend on gopher tortoise burrows for overwintering shelter compared to populations in the southern portion of the range (Peninsular Florida) where dependence is less.
For this SSA we defined the extent of the eastern indigo snake populations across the entire range by buffering all records by 5 mi (8 km). Five miles was found to be the approximate maximum annual linear movement distance for eastern indigo snakes in Georgia (Table 1), where the species is believed to move the longest distances. Five miles is twice the approximate maximum annual linear movement distance documented in Peninsular Florida (Table 1). A population has the potential to occur where at least two eastern indigo snake records occur within 5 mi of each other. A similar approach was used to define “populations” for the black pine snake (USFWS 2015). Overlapping buffer areas were merged and assumed to represent the potential maximum extent of populations used in this assessment. Using maximum extent aims to capture the majority of the area potentially used by an individual but also over-estimates the actual area used, or occupied, by that individual. An example of how populations were delineated is provided in Figure 20. Figure 21 depicts delineation of all the eastern indigo snake populations assessed in this report.

The following rationale and assumptions were made when defining populations (see Appendix B for additional explanation.
1. Home range size vs linear movement: Although we have good estimates of home range size for eastern indigo snakes, application of the home range area as a circle could exclude significant areas used by eastern indigo snakes due to variation in home range widths and shapes. Alternatively, we buffered records by maximum annual linear movement distance to estimate the potential maximum extent of the home range for a given record (see Appendix B, Figure B1 for illustration). This approach is inclusive and captures all the area possibly used by the eastern indigo snake responsible for a given record and therefore represents its biological potential to move in a given area.
2. Five-mile buffer distance: While northern populations generally have larger home ranges and move longer distances it is assumed that southern populations (Peninsular Florida) could also move 5 miles (one male in central Florida was documented to travel about 4.3 mi (7 km) (Breininger and Bolt unpublished data). In addition, snakes may move longer distances than documented because long-distance movements are harder to detect. Missing snakes have been reported from radio-telemetry studies (e.g. Hyslop 2007, Godwin and Steen 2011, Breininger et al. 2011) which may be due to snakes moving outside study areas.
3. Demographic connectivity: We assume that eastern indigo snakes that are within 5 mi of each other have increased probability of population persistence (re-colonization of sites after a stochastic event or local extirpation) resulting from periodic addition of immigrants from sources to sinks (Carlson et al. 2014, p. 521) within the populations defined in this assessment (e.g. immigrants from an area with good quality habitat into an area adjacent to (sub)urban development). Dispersal of individuals over longer (greater than 5 mi) distances is rare but is important for population connectivity (i.e. genetic connectivity at a wider scale than within-population demographic connectivity).
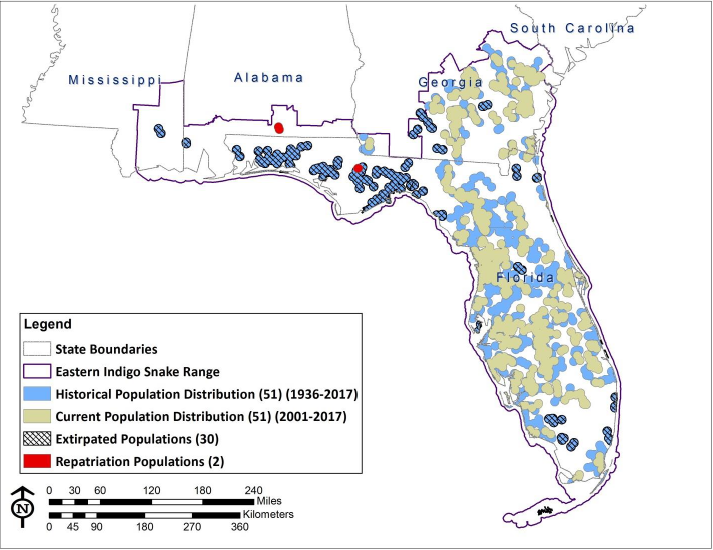
Figure 21: Historical and current distribution and extent of eastern indigo snake populations.
To examine the persistence over time in extent and number of populations, we buffered all records (years 1936-2017) to estimate the historical population distribution. Next, we buffered only those records from 2001-2017 to estimate the distribution of current populations, similar to Enge et al. (entire, 2013). Due to poor species detectability and uneven survey and monitoring data, the number of records varies across the range with some areas having more records from research and monitoring efforts to other areas having no or few records which could represent lower numbers of snakes or that the area is under-surveyed. For both historical and current populations we only included populations that had two or more records within 5 mi of each other. Forty-one (41) and 15 single record populations were excluded from the analysis for historical and current populations, respectively. This delineation resulted in 51 historical populations and 53 current populations, including 2 repatriated populations (Figure 21). However, the current populations represent a decrease in the overall distribution of historical populations due to fragmentation of the larger historical populations into multiple smaller populations (now 53 current populations within 21 of the historical populations), and the extirpation of 30 of the historical populations. The average extent (or area) of the historical population distribution was 471,778 ac (190,921 ha) while the average extent of the current population distribution is 237,836 ac (92,248 ha). The 53 current and the 30 extirpated populations represent the total number of populations (83) considered in the population resiliency analysis. See the Representation section 5.3 below for more discussion regarding historical and current populations.