A GIS model was generated for the eastern indigo snake to assess the current range-wide status of habitat availability and quality. The model identified 39.6 million acres (16.0 million ha) of potential habitat within the known range of the species; however only 16% of this area is within the known extent of eastern indigo snake populations (Figure 22, see section 5.2.2). The potential habitat within the current population extent of eastern indigo snakes (identified by buffering records by 5 mi as described in section 5.1) is estimated at 6.4 million ac (2.7 million ha). Habitat patches were categorized as primary, secondary and tertiary habitat. Primary habitat identifies the characteristic natural upland habitats preferred by eastern indigo snakes across most of its range. Secondary habitats include other natural habitats, including lowlands, often important for foraging. Tertiary habitats include human-altered landscapes (e.g. pasture, citrus orchards) that may also support critical resource needs.
Source Datasets Used
USGS National GAP Landcover – The GAP National Terrestrial Ecosystems – Ver 3.0 is a 2011 update of the National Gap Analysis Program Land Cover Data – Version 2.2 for the conterminous U.S. The GAP National Terrestrial Ecosystems – Version 3.0 represents a highly thematically detailed land cover map of the U.S. The map legend includes types described by NatureServe’s Ecological Systems Classification (Comer et al. 2002) as well as land use classes described in the National Land Cover Dataset 2011 (Homer et al. 2015). These data cover the entire continental U.S. and are a continuous data layer. These raster data have a 30 m x 30 m cell resolution. The land cover map identifies 107 different land cover types within the range of the Eastern Indigo Snake.
GA Gopher Tortoise Model– With federal, state, and other partners, The Georgia Cooperative Fish & Wildlife Research Unit at the University of Georgia (UGA Research Unit), assessed the status of the gopher tortoise to inform listing and conservation management decisions to stabilize and recover gopher tortoise populations.
Using a comprehensive database of 63,354 occurrence records and expert input contributed by partners, the UGA Research Unit developed a range-wide species distribution model to identify and rank suitable habitat and measure the influence of environmental attributes on habitat suitability. Tortoise habitat suitability was positively associated with well-drained, sandy soils, compatible land cover, Topographic Position Index, and fire frequency and was highest for intermediate values of canopy cover. Together, these results highlight distributions of suitable habitat, protected areas of suitable habitat where continued management may be a priority, and opportunities for acquiring suitable but currently unprotected areas. The model output has a data range of 0 – 1, a continuous scale of habitat suitability from unsuitable habitat (0 Value) to suitable habitat (1 value). A suggested cutoff values to create a binary representation of potential habitat are 0.21 and 0.47, with 0.47 being a stricter cutoff value that minimizes the rate of false positives and negatives.
Tele Atlas U.S. Major Highways- Represents the major highways of the United States (Tele Atlas 2010). These include interstates, U.S. highways, state highways, and major roads.
Defining the range
The range of the eastern indigo snake was delineated by including all counties that overlapped an Eastern Indigo Snake range map (Enge et al. 2013, entire). We also included a small number of additional counties to shorten and make more linear the county boundary delineation. The county boundary delineation includes all parts of the Indigo’s range; present, possible historical, likely extirpated, and extirpated.
Model Steps
The USGS National GAP Landcover dataset was clipped to the range of the indigo snake and reclassified three categories corresponding to eastern indigo snake habitat priorities: primary, secondary and tertiary habitats (Table C1). Primary habitat identifies the characteristic upland habitats used by eastern indigo snakes, secondary habitat identifies the foraging habitats used by eastern indigo snakes, and tertiary habitat identifies foraging habitats that are human altered. Our classification scheme was based upon expert opinion.
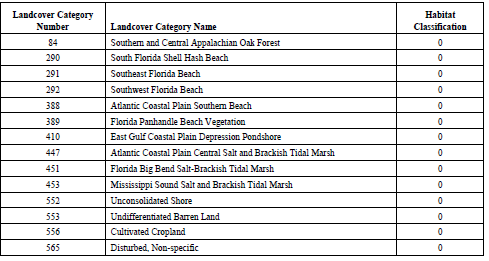
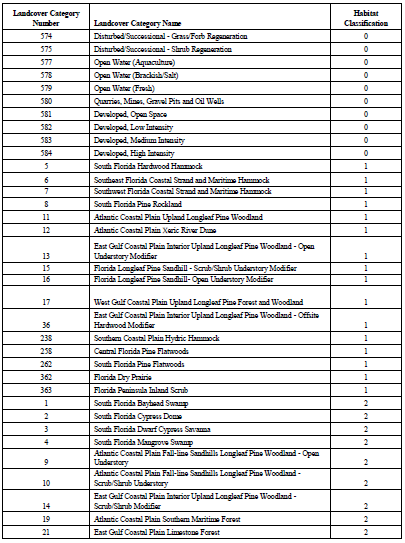
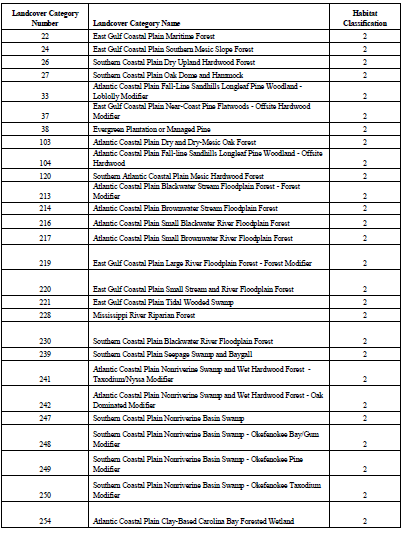
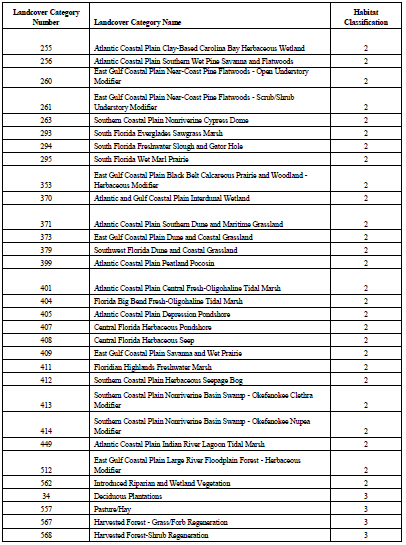
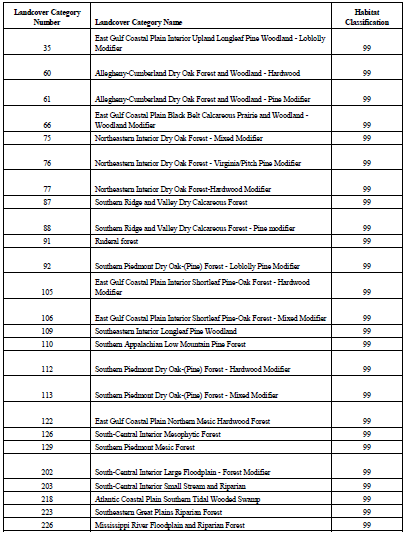
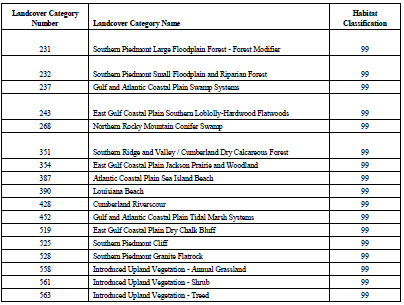
Classification Codes: 0 = Non-indigo snake habitat within indigo range extent, 1 = Primary habitat within indigo extent, 2 = secondary habitat within indigo extent, 3 = tertiary habitat within indigo extent, 4 = Areas not classed in the landcover (i.e. classed as 0 in the landcover, such as disturbed/successional – grass/forb regeneration) but was identified as gopher tortoise habitat in the UGA Model (see description), and 99 = landcover classes outside the indigo extent.
To augment the primary habitat identification for indigo snakes, we reclassified the UGA Gopher Tortoise potential habitat map to retain all areas that scored greater than 0.47 and merged them with the landcover-derived indigo snake primary habitat data layer. A score of 0.47 or greater in the UGA Gopher Tortoise potential habitat map is a stricter cut-off point that minimizes the rate of false positives and negatives (Crawford and Maerz 2017). The higher scoring UGA Gopher Tortoise potential habitat map areas further identify core habitat areas in the range of the indigo snake which the landcover map alone did not identify. With this merged dataset we selected all primary habitat patches greater than 10 acres in size and removed (clipped) all identified areas within the redhills region of Florida and Georgia where eastern indigo snakes are not believed to have occurred historically (Enge et al. 2013).
References:
Crawford, B. A. and Maerz, J. C. 2017. Range-wide species distribution models for at risk species in the longleaf ecosystem. Draft report. 24pp.
Elliott, M.J. 2009. Distribution and ecological integrity of sandhills habitats in Georgia (digital data). Georgia Department of Natural Resources, Wildlife Resources Division, Nongame Conservation Section, Social Circle. 1:24,000.
Endries, M., B. Stys, G. Mohr, G. Kratimenos, S. Langely, K. Root, and R. Kautz. 2009. Wildlife Habitat Conservation Needs in Florida. Fish and Wildlife Research Institute Technical Report TR-15.x + 178p.
Enge, K.M., D.J. Stevenson, M.J. Elliott, and J.M. Bauder. 2013. The historic and current distribution of the eastern indigo snake (Drymarchon couperi). Herpetological Conservation and Biology, 8(2):288-307.
Tele Atlas North America Inc. 2010. U.S. Major Highways (Digital Data), ESRI, Redlands, California, USA.
U.S. Fish and Wildlife Service. 2012. Gopher Tortoise (Gopherus polyemus) Soil Classifications for the Federally Listed Range using the National Soils Information System Database. Unpublished report by the USFWS Mississippi Ecological Services field office, Jackson, MS.
U.S. Geological Survey. 2013. Southeast Gap Analysis Project Land Cover Mapping. Available at <http://www.basic.ncsu.edu/segap/index.html>.