The overall current distribution of the species has considerably contracted from the historical distribution (see section 5.6). In some areas the current land conservation status may protect against further declines associated with urbanization, however effects from sea level rise may not be ameliorated.
Urbanization and sea level rise both will cause considerable losses of eastern indigo snake habitat within the current population extent across the range, from a 15% loss in the low development scenario at year 2050 to as much as 34% loss in the high development scenario by year 2070 (Table 8). Urbanization has the greatest impact on overall percent habitat loss in the North Florida region (33% by 2050, and 47% by 2070 with moderate development (Scenario B)), followed by the Peninsular Florida, Southeast Georgia, and Panhandle regions (Table 8).
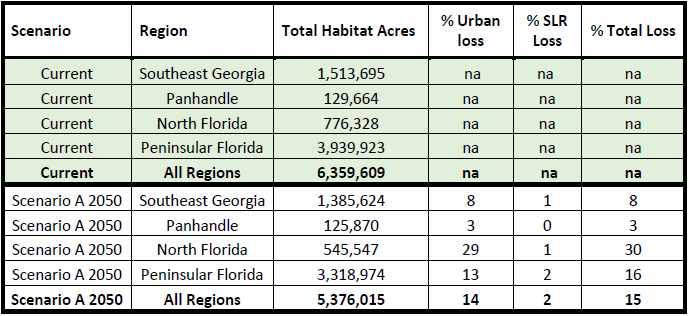
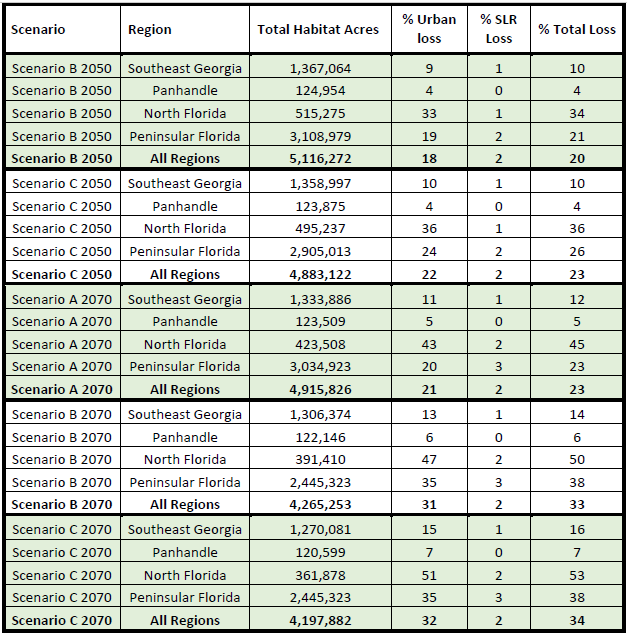
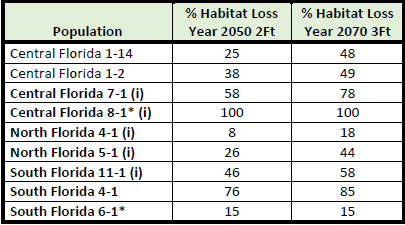
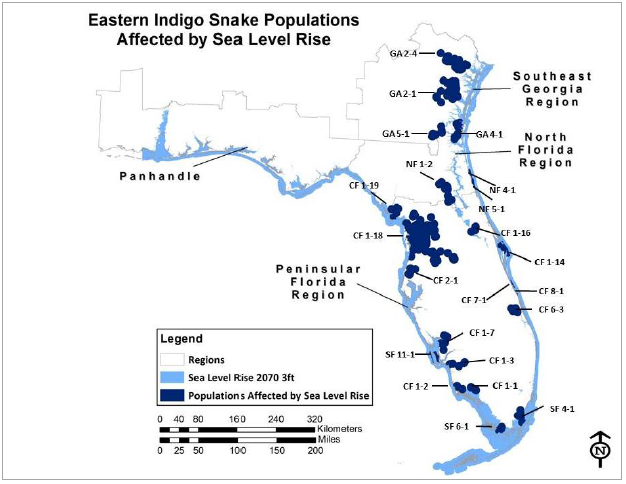
Habitat loss from seal level rise is greatest in Peninsular Florida (2-3%) and is relatively low compared to urbanization throughout the range of the eastern indigo snake. Sea level rise contributes to measurable habitat losses for 22 of the 53 current populations (Figure 27), with significant losses for the island populations (Table 9). Population extirpation due to loss of habitat from sea level rise occurs by 2050 (2ft sea level rise) and no additional populations are lost by 2070 (3ft sea level rise). Seven populations listed (in bold) in Table 9 are considered extirpated in all future scenarios due to loss of habitat from sea level rise.
6.3.1 Scenario A (Low Development)
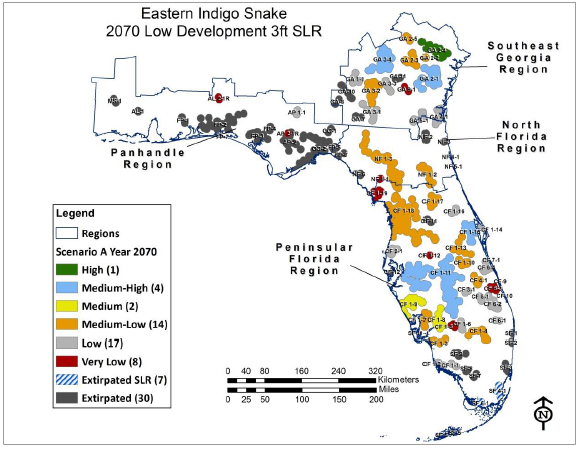
In the Scenario A, population resiliency declines from current condition having only one highly resilient population remaining throughout the range in Southeast Georgia (GA 2-4) (Figure 28). Several medium-high and medium resilient populations remain in Southeast Georgia and Peninsular Florida. In Southeast Georgia, populations GA 2-3 and 3-2, decline from a medium current condition to medium-low future condition which may be reduce connectivity among the Georgia populations. Given their central location within the eastern indigo snake range, the decline of populations NF 1-3 and NF 1-2 (by 2070) in North Florida and CF 1-18 and CF 1-17 in Peninsular Florida from medium to medium-low resiliency may reduce connectivity among populations necessary to maintain gene flow across the species’ ecological and genetic gradients. Also notable is the resiliency of population CF 1-11 in Peninsular Florida declines from highly resilient in its current condition to medium-high. By 2070 the decline of additional Peninsular Florida populations CF 1-10 and CF 1-13 from medium-high to medium-low resiliency further reduce connectivity among populations in this region. Seven populations are lost to sea level rise, NF 1-4 and 1-5 in North Florida and CF 7-1, CF 8-1, SF 4-1, SF 6-1 and SF 11-1 in Peninsular Florida. Resiliency condition classes for each population are listed in Table D3 (Appendix D).
6.3.2 Scenario B (Moderate Development)
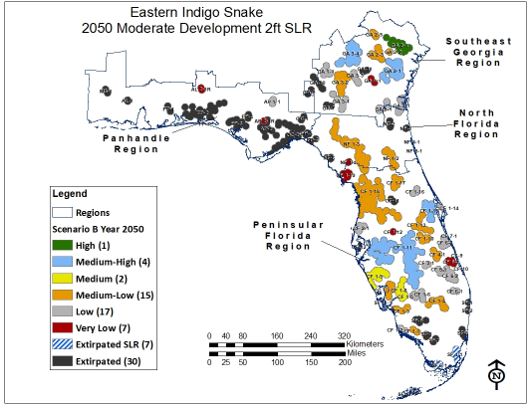
In Scenario B, population resiliency at 2050 remains about the same as Scenario A at 2070 condition having only one highly resilient population remaining throughout the range in Southeast Georgia (GA 2-4) (Figure 29). By year 2070, populations in Southeast Georgia and North Florida remain the same as 2050, however in Peninsular Florida populations CF 1-11 and CF 1-15 decline from medium-high to medium condition and CF 1-8 declines from medium to low. Resiliency condition classes for each population are listed in Table D3 (Appendix D).
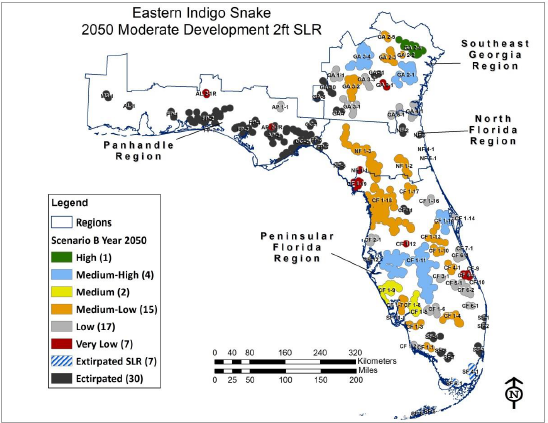
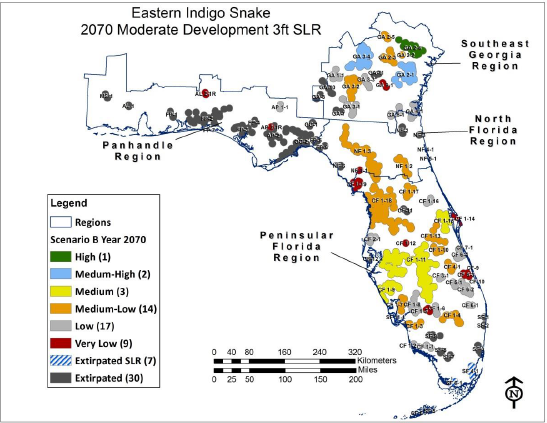
Figure 29: Eastern indigo snake population resiliency condition classes for Scenario B (moderate development) at year 2050 (2 ft sea level rise) and year 2070 (3 ft sea level rise).
6.3.3 Scenario C (High Development)
In Scenario C, population resiliency at 2050 is very similar to the population resiliency in Scenario B at 2070 (Figure 30). Population resiliency remains the same in Southeast Georgia and North Florida with one highly resilient and two medium-high resilient populations remaining in Southeast Georgia, and no high to medium resilient populations in North Florida. Three medium resilient populations remain in Peninsular Florida. Between 2050 and 2070, the east-central area of Peninsular Florida experiences additional declines due to urbanization where CF 1-14 becomes very low, CF 1-13 becomes low, and CF 1-15 becomes medium-low. Population GA 3-4 in Southeast Georgia also declines from medium-high to medium condition. Resiliency condition classes for each population are listed in Table D3 (Appendix D).
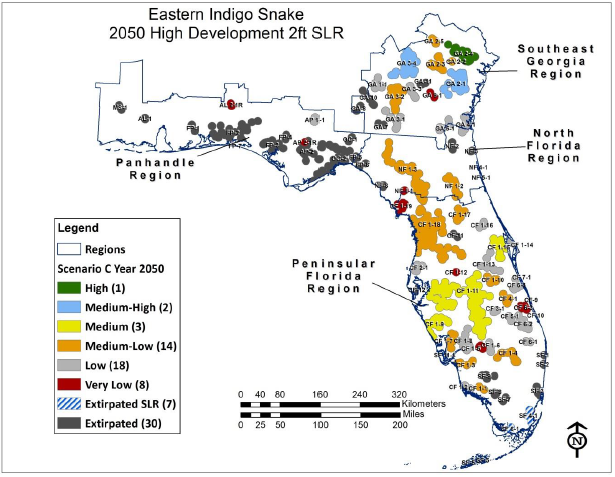
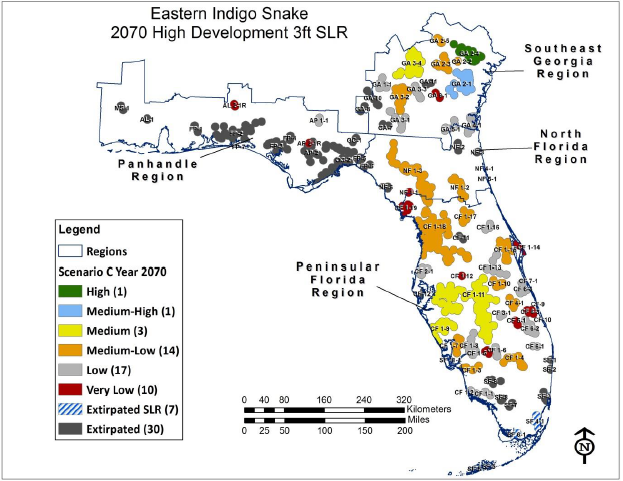
Figure 30: Eastern indigo snake population resiliency condition classes for Scenario C (high development) at year 2050 (2 ft sea level rise) and year 2070 (3 ft sea level rise).
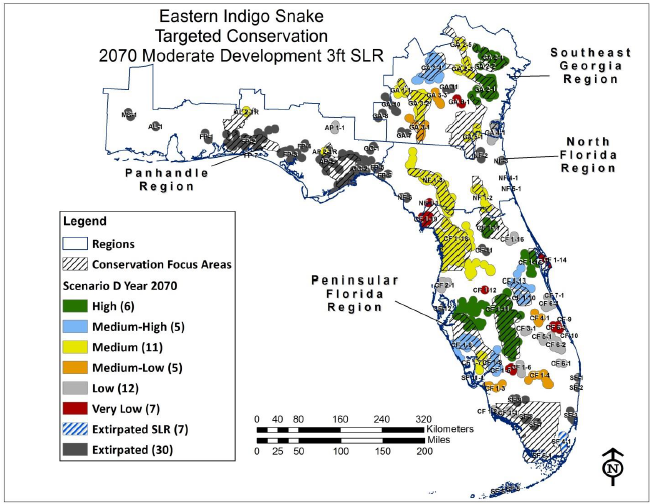
6.3.4 Scenario D (Targeted Conservation)
In Scenario D, moderate urbanization at year 2070 (Scenario B) is assumed with focused conservation efforts in Conservation Focus Areas (CFAs). Current population resiliency is maintained or improved within 16 proposed CFAs, with about 6 highly resilient populations across Southeast Georgia (3) and Peninsular Florida (3), 2 medium resilient populations are maintained in North Florida and at least 2 restored populations in the Panhandle (Figure 31). In all previous scenarios the 2 on-going repatriation sites remain in very low condition assuming conservation efforts are minimal at these sites, however with conservation focus these populations are assumed to be successful and in medium condition by year 2070. Medium resiliency for the repatriated sites is a conservative estimate. It may be possible for these populations to improve to medium resiliency before 2050 or a higher resiliency by 2070. In the conservation targeted scenario conservation efforts (i.e. funding) are expanded and up to 2 additional repatriated (or restored) populations in the Panhandle region are considered depending on the success of the on-going repatriation projects (AL 2-1R and AP 2-1R). Resiliency condition classes for each population are listed in Table D3 (Appendix D).
Future Condition Resiliency Summary
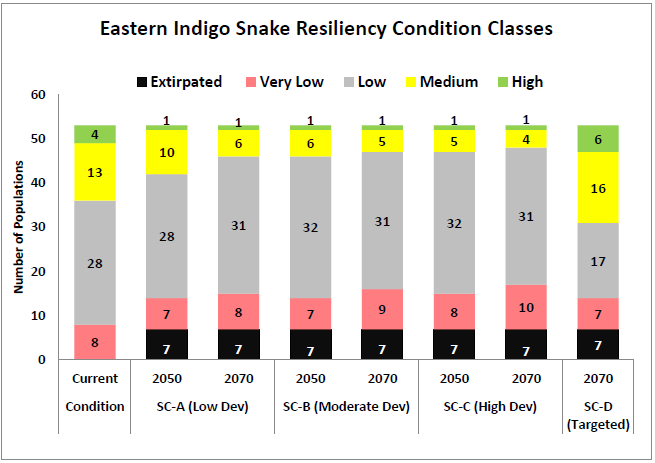
The resiliency of the eastern indigo snake declines across all scenarios and time steps, except the Targeted Conservation scenario where focused conservation maintains and potentially increases the number of highly resilient populations to 6 with numerous medium resilient (16) populations (Figure 32, Table D3 in Appendix D). Habitat losses due to urbanization, with some impact from sea level rise, contribute to the overall decline in the resiliency of eastern indigo snake populations. As expected the worst case scenario is the high development scenario (Scenario C) where 48 (out of 53) populations are projected to be low to very low or are extirpated and only one highly resilient population persists (GA 2-4, Fort Stewart) (Figure 32). Projected population resiliency declines across scenarios (A-C) and timesteps where high and medium resilient populations decline to low and very low with increased development over time and only one highly resilient population is expected to persist.