At the time of listing under the Endangered Species Act in 1978, the eastern indigo snake was considered a subspecies of indigo snake, Drymarchon corais couperi (USFWS 1978). Post-listing, Collins (1991, p.43) elevated this lineage to species status based on geographic isolation and morphology. Subsequent work supported this designation and the eastern indigo snake was accepted by the scientific community as its own species, Drymarchon couperi (Wüster et al. 2001, p.163, Crother 2012, p.59). The Service adopted this change in nomenclature in 2008 (USFWS 2008, p.23). In addition to the eastern indigo snake, other common names include blue indigo snake and blue gopher snake.
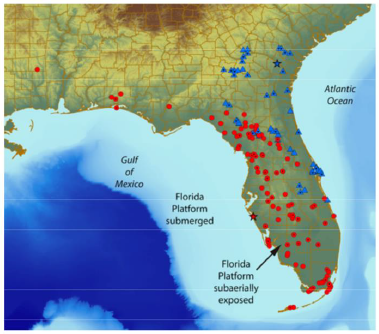
Ongoing genetic studies further evaluating taxonomic classification have only recently been conducted. Shamblin et al. (2010, entire) used 22 nuclear microsatellite markers to successfully differentiate individual snakes from Fort Stewart, Georgia, and suggested the technique used in their genetic analysis could also prove valuable in conducting population level studies. Krysko et al. (2016b, entire) evaluated the genetic diversity of 20 eastern indigo snakes across Florida and southern Georgia using mitochondrial DNA (mtDNA) derived from tissue samples. Krysko et al. (2016b, entire) described a divergence of the species into two genetic lineages, an Atlantic lineage occupying southeastern Georgia and northeast Florida and a Gulf lineage occupying southern Florida, the central Lake Wales Ridge of Florida, the Gulf Coast drainage of Florida, and the panhandle region of western Florida (Figure 4). The authors hypothesized that these two lineages represent two different species of indigo snakes (Krysko et al. 2016a, b, entire), and described differences in scalation which they assert provide a method to morphologically distinguish between the two species. These two lineages illustrate a similar biogeographic pattern previously identified for other plants and animals that have come in and out of contact with each other many times during historic sea level changes. Nevertheless, in certain areas of Florida, this potential classification would place the two eastern indigo snake lineages in close enough proximity that no barrier to gene flow would exist between them (Figure 4). This region was described by Krysko et al. (2016b, p. 566) as a hybrid zone between the two lineages.
More recent data bring into question the validity of splitting the eastern indigo snake into two species. Genetic diversity was further evaluated by Folt et al. (2019) using microsatellite (nuclear) DNA (nDNA) from 428 tissue samples of eastern indigo snakes from across the species range, including the 20 samples used by Krysko et al. (2016a). These genetic analyses supported multiple populations within eastern indigo snakes; however the geographic pattern suggested a north-south orientation rather than a Gulf-Atlantic orientation and the contemporary gene flow was widespread across this geographic pattern (Figure 5) (Folt et al. 2019). Folt et al. Genetic distance was strongly correlated with geographic distance across the range when samples were separated into both north-south clusters and Gulf-Atlantic clusters. Folt et al. (2019) concluded that genetic structure among populations is best described as continuous isolation by distance along a north-south geographic axis within a single species. 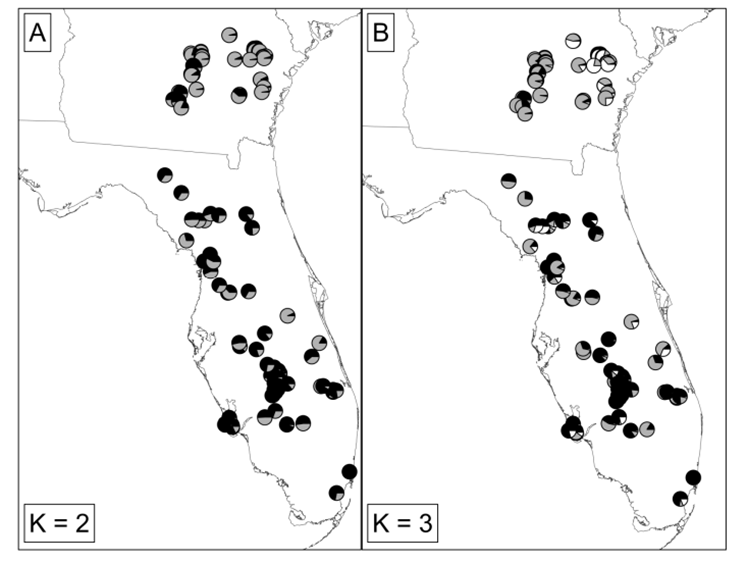
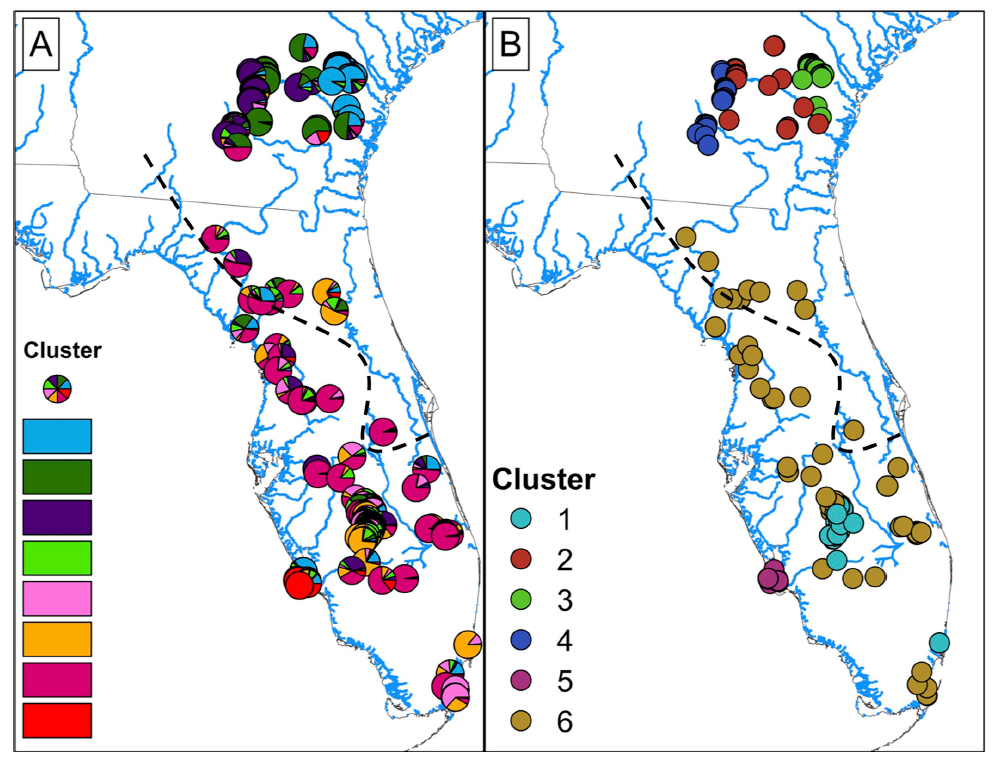
Figure 5. Maps of Drymarchon couperi (sensu lato) sampling sites represented as (A) pie charts of percent ancestry within population clusters identified by Structure analysis K = 8 populations,and (B) cluster membership from the Geneland analysis with K = 6 populations. For both panels, percent ancestry and/or cluster membership was assigned given the number of populations K that received the highest support during the analysis. The black dashed lines indicates the boundary between the Atlantic and Gulf lineages from Krysko et al. (2016b), Figure borrowed from Folt et al. (2019).
In addition, Folt et al. (2019) suggest that this high level of contemporary gene flow between eastern indigo snakes and the inconsistent patterns between mtDNA and nDNA may be driven by high dispersal of male snakes relative to females. Since female eastern indigo snakes move over much smaller distances than males, it would follow logically that results from a study of mtDNA (Krysko et al. 2016b, entire), which passes maternally, would show population sub-structuring among females that may not be reflected in contemporary patterns of nDNA. The differences in movement and home ranges between male and female eastern indigo snakes are well documented (see Section 2.3.1), with males on average having larger home ranges, moving more frequently and over longer distances. This type of life history limits the utility of mtDNA alone to reveal novel species (Folt et al. 2019).
Because of the differences in inheritance and mutation rates, mtDNA is often used to determine species phylogeny and systematics, while patterns in nDNA illustrates more contemporary gene flow and population subdivision (Sunnucks 2000, p. 200). Folt et al. (2019) suggest that even if a historical climatic event may have separated D. couperi into two populations described by Krysko et al. (2016a,b, entire) using mtDNA, that the observed levels of contemporary gene flow (nDNA) erase any historical differentiation. Furthermore, there has not been adequate analysis to determine if the pattern of scale differences described by Krysko et al. (2016a, entire) occurs consistently throughout the eastern indigo snake range to support separate diagnosable species based on morphology.
A similar pattern of a species separated and re-joined during cycles of glaciation has occurred in the North American pitvipers of the Agkistrodon genus (cottonmouths) (Burbrink and Guiher 2015, Strickland et al. 2014). Burbrink and Guiher (2015) provided statistical support for the separation of Florida cottonmouths from continental cottonmouths into two separate species. Strickland et al. (2014) provided statistical support that cottonmouths are a single species with gene flow across the Gulf Coastal Plain. These reported taxonomic differences may be the result of markers that reflect different time scales, contemporary versus historic (Strickland et al. 2014). It is possible that the data from eastern indigo snake lineages may be explained by the same pattern; mtDNA reflect historical patterns in female eastern indigo snake genetics and nDNA provides a contemporary perspective of genetic diversity and gene flow in the species.
Until further research provides additional clarity or the scientific community has examined and accepted the eastern indigo snake taxonomic change suggested by Krysko et al. (2016a b, entire), the Service maintains the eastern indigo snake, Drymarchon couperi (Collins 1991), as one species.